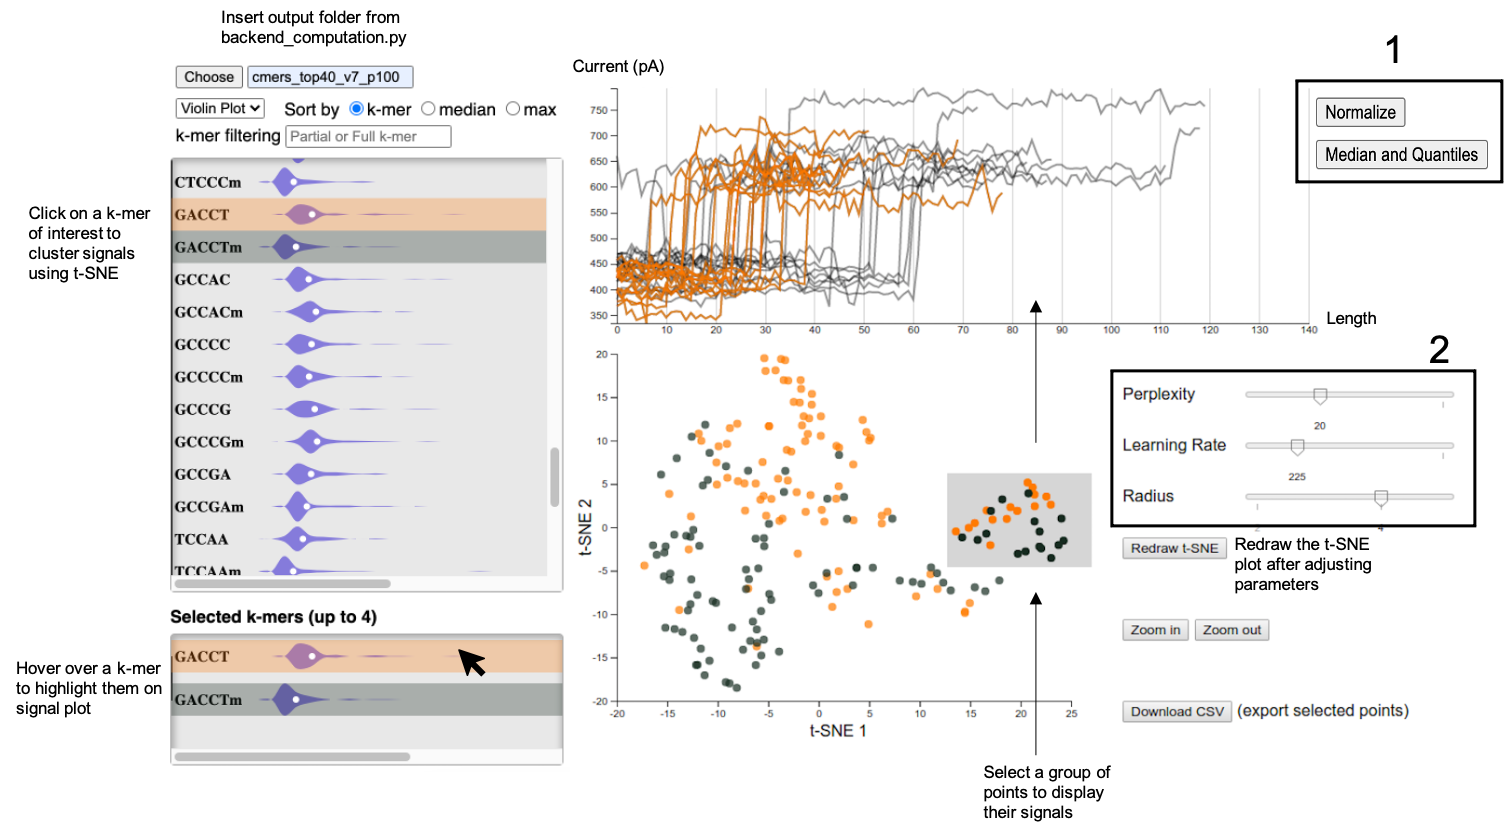
1.) Signal Representation
Normalize: Making all signals to have the same length
Median and Quantiles: Summarizing signals in each k-mer using their medians and quantiles
2. ) Parameters
A t-SNE perplexity generally has a value between 5 and 50. The visualization can be different depending on the value. The perplexity is related to the number of nearest neighbors each point would have. Larger datasets usually require a larger perplexity. This following site is a good resource if you would like to dig deeper. https://distill.pub/2016/misread-tsne/
A learning rate controls the gradient updates step size. A default value of around 200 generally works well. A larger dataset may need a larger learning rate.
A radius basically controls how large the circle size on the plot would be. If there are many points to display, a smaller radius would make it easier to look at.